|
|
 |
|
|
|
|
OVER THE COUNTER BULLETIN BOARD EXCHANGE
MARKET STRUCTURE, RISK AND RETURN Abstract
This study was motivated by the lack of knowledge of the OTC-BB Exchange and seeks to fill this void by enlightening investors about the
structure of the OTC-BB Exchange and by providing estimates of the market's risk and return for the period January 1, 1995, through December 31, 1998. This research is an initial attempt to provide some
empirical insights and analysis about the Over the Counter Bulletin Board Market. We found that a portfolio of equally weighted OTC - BB securities would have yielded a lower return and higher risk (as
measured by standard deviation) than obtained by investing in equally weighted portfolios found on the larger exchanges for the time period of January 1, 1995, through December 31, 1998. We also observed
that the relationship of returns of OTC-BB securities to the securities traded on the American Stock Exchange, New York Stock Exchange, Nasdaq and the S&P 500 is relatively weak. We believe that the
reason for these results is the lack of financial information and poor liquidity. |
|
|
Introduction Each day, thousands of
investors buy and sell securities listed on the Over the Counter Bulletin Board Exchange ("OTC-BB" or "Exchange"). Shares in thousands of firms are traded in this market and it is generally believed
that these securities are "risky." However, there has been no comprehensive empirical research performed on the OTC-BB. We found it surprising that these OTC-BB firms never have been examined
from a risk and return perspective. This study seeks to fill this informational void by enlightening investors about the structure of the OTC-BB Exchange and by providing estimates of the market's risk
and return for the period January 1, 1995, through December 31, 1998. We believe that this information will help investors make informed portfolio decisions regarding these OTC-BB firms.
The remainder of the paper is organized as follows. Section 1 reviews the history and discusses the market structure of the Over the Counter Bulletin Board Exchange. Section 2 discusses the
data and research methodology. Section 3 presents the empirical results and conclusions, and the fourth section provides a summary and suggestions for future research. Section 1 The Over the Counter Bulletin Board Exchange
A. History In June of 1990, the OTC-BB began operation as part of The Penny Stock Reform Act of 1990 which mandated the United
States Securities and Exchange Commission ("SEC") to establish an electronic system to facilitate the widespread publication of quotation and last trade information. Since December 1993, firms have
been required to report trades in all domestic OTC equity securities through the Automated Confirmation Transaction Service ("ACTSM") within 90 seconds of the transaction. The benefit of these structural
modifications was to permit greater price transparency to investors.
On January 4, 1999, the SEC approved the OTC-BB Eligibility Rule. This meant that beginning in July of 1999,
and phasing in through June 2000, firms whose shares were to trade on the Exchange were required to disclose current financial information to a regulatory body (typically the SEC). Firms refusing to
publicly disclose their financial information were delisted from the OTC-BB. Subsequently, these firms listed their shares on the National Quotation Bureau Exchange ("NQB", or "Pink Sheets"). Prior to this
rule, no OTC-BB firms were required to disclose any financial information. All disclosure was on a voluntary basis. During the mid-1990's, there were about 6,000 firms trading on this
exchange. As a result of the OTC-BB Eligibility Rule, the number of OTC BB listing firms decreased considerably during the late 1990's. |
|
|
|
|
|
|
|
Exhibit 1 Number of OTC-BB Securities
|
|
|
|
Year |
Number of Securities Listed |
August 2000 |
3,575 |
1999 |
5,499 |
1998 |
6,613 |
1997 |
6,462 |
1996 |
5,742 |
1995 |
5,450 |
|
|
|
|
Interestingly, while the number of firms trading on the OTC BB was shrinking, the dollar volume of activity on the Exchange was
increasing, significantly. Exhibit 2
OTC-BB Daily Average Dollar Volume |
|
|
|
Year |
Dollar Volume |
2000 average through August |
$528,389,416 |
1999 |
$247,623,003 |
1998 |
$105,957,309 |
1997 |
$81,850,620 |
1996 |
$72,645,913 |
1995 |
$38,164,497 |
|
|
|
|
Virtually all of the securities traded in this Exchange are microcap stocks. Generally, microcap companies are those firms
that: have small asset bases and revenues, tend to be low priced, trade in low volumes, and have market capitalizations below $250 million. Certainly by comparison to the other major United States
exchanges, dollar volume of OTC BB securities is a fraction of what occurs elsewhere.A major difference between a microcap security and other stocks is the amount of reliable, publicly
available information about the company. There is a plethora of information about large firms that trade on the major United States exchanges; in contrast, it is difficult to find reliable information
about microcap securities. If information exists at all, its source is either the company itself or a promoter paid by the firm. There is little institutional coverage for OTC securities. B. OTC BB Market StructureAn OTC equity
security generally is any equity that is not listed or traded on Nasdaq® ("Nasdaq") or other national securities exchanges such as the New York Stock Exchange or the American Stock Exchange. The OTC-BB is a
regulated quotation service that collects and distributes real-time quotes, transaction prices, and volume data for OTC securities. The OTC - BB is a quotation medium for subscribing members (i.e., the
Market Makers) and is not an issuer listing service. This is a subtle but very significant difference. The OTC-BB's relationship is with the firm making a market in the OTC security rather than
with the issuer. For the other major United States securities exchanges the relationship is between the exchange and the company, not a broker-dealer making a market in that firm's security. OTC - BB securities are traded by Market Makers that enter quotes and execute trades through a closed computer network, which is accessed through a Nasdaq Workstation. Securities traded on the
OTC-BB include national, regional, and foreign equity issues, warrants, units, American Depositary Receipts ("ADRs"), and Direct Participation Programs ("DPPs"). The OTC - BB operates as a
dealer system. As a result, all securities being quoted on the OTC - BB must be sponsored by a participating Market Maker that registers the security with the NASD OTC Compliance Unit along with the
required issuer information. Once approved by the Compliance Unit, the Market Maker will be notified that it has been registered in the security and may enter a quote and commence trading. Only Market
Makers can apply to quote securities on this service. Issuers contact an authorized OTC - BB Market Maker for sponsorship of a security on the OTC - BB. The OTC - BB is different than the
Nasdaq market and the other major United States exchanges in that it: does not impose minimum quantitative financial listing standards (i.e., a minimum net worth or market capitalization requirement); does
not provide automated trade executions; does not maintain relationships with quoted issuers; and does not have the same obligations for its Market Makers. However, upon delisting from the Nasdaq or other
national exchange, a security may move to the OTC BB Exchange. The OTC - BB Eligibility Rule Phase-in began on July 1, 1999, and was completed as of June 2000. The objective of the Eligibility Rule
was to protect investors by ensuring that they have access to OTC companies' current financial information when considering OTC investments. During the latter half of 1999 and first half of 2000, every
company whose securities were quoted on the OTC - BB was reviewed for compliance with the filing requirements for publicly disseminated financial statements. As a result, in excess of 3,000 firms were
delisted and removed from the OTC BB. In general, these firms' securities were then traded on the NQB exchange. Nasdaq is in charge of monitoring the filing status of all OTC - BB issuers. In
the event of a filing delinquency, Nasdaq will disclose that the financial statements on file are not current. After 30 days, if Nasdaq has not been notified that the appropriate filing has been made
with the issuer's regulatory authority, the issuer's security will be removed from the OTC - BB.
C. A Comparison of the Nasdaq to the OTC - BB
There are very significant differences between firms listing their securities on the OTC - BB and Nasdaq. It is relatively easy to obtain
a listing on the OTC BB. On the other hand, Nasdaq, as well as the other major United States exchanges, has rigorous listing standards to ensure a minimum quality of its issuers. Beginning in 1999, the
only requirement of significance for inclusion in the OTC - BB is that an issuer be current in required periodic filings with the SEC or other appropriate federal regulatory authority; prior to 1999, even
disclosing financial statements was optional. The major United States stock exchanges have specific quantitative and qualitative listing and maintenance standards that are stringently monitored
and enforced. Companies listed on one of those exchanges have reporting requirements to the exchange and a direct relationship exists between both parties. In contrast, the OTC BB does not impose a
minimum level of financial standards, and there is no business relationship between the quotation service and the issuers. Because the OTC BB is a quotation service for its Market Makers and not an
issuer listing service or securities exchange, there are no quantitative listing requirements that must be met by an OTC BB issuer other than to issue financial statements. To be delisted from the
OTC BB exchange, a firm either fails to file its financial statements in a timely manner with the required regulatory body, or all of its Market Makers withdraw from the stock. Since there is no
business relationship between the OTC BB and the issuer, it is the Market Maker that chooses to quote a security on the system, files the application, and is obligated to comply with the regulatory
requirements. The NASD Regulation governs the quotation activity and trade practices of OTC BB Market Makers, but OTC BB issuers are not regulated by Nasdaq.
D. A Comparison of the OTC BB to the Pink SheetsJust as the OTC-BB is distinct
from Nasdaq, it is also distinct from the NQB. The NQB transmits pricing information via paper (i.e., pink paper) and more recently via the internet. The Pink Sheets are not owned or operated by
Nasdaq or the OTC BB; they are owned by an independent firm. It is important to note that firms listing on the NQB are not required to disclose their financial statements to any regulatory body, and the
SEC does not require firms listing their shares on the NQB to disclose their financial statements. The NQB is the only securities exchange in the United States that permits firms to trade their
securities without disclosing their financial statements. Prior to the enactment the Eligibility Rule, NQB and OTC-BB traded companies were the only publicly traded companies that were not
required to disclose their financial statements. Now that the Eligibility Rule is completely implemented, the NQB is the last remaining haven in the United States for public trading of non-disclosing
companies. Section 2 Data and Research Methodology We studied the financial performance of OTC BB firms from January 1, 1995, through December 31, 1998, when approximately 6,000 stocks were traded on this
Exchange. The typical company traded on the OTC - BB is small (whether considered in terms of market capitalization, revenue, net income or float) and infrequently traded. Although these stocks are
traded infrequently, there is an observable share price. Thus, pricing information did exist for these securities. We obtained OTC - BB daily price and volume data for the calendar
years 1995 through 1998. Unfortunately, the raw data had to be edited, corrected and completed for each company. The data on the tapes were not consistent with regard to company name and ticker
symbol. Furthermore, we did not have any information concerning the number of shares outstanding. Thus, company name and ticker symbol had to be verified and made consistent from month to month
and year to year. Then, information regarding each firm's outstanding common shares was gathered manually from corporate disclosure statements. If firms did not file any statements, then they had
to be dropped from the data set. This resulted in a sample of approximately 2,000 firms with reliable data for the 1995 through 1998 calendar years. Once the raw data had been compiled and verified, each
firm's market capitalization had to be determined. Share prices were adjusted for splits, dividends, and capital infusions using the same procedure employed by the Center for Research in Security
Prices, ("CRSP"). After adjusting each firm's price, monthly market capitalization values were determined. These market capitalization values were used to generate monthly percentage changes in
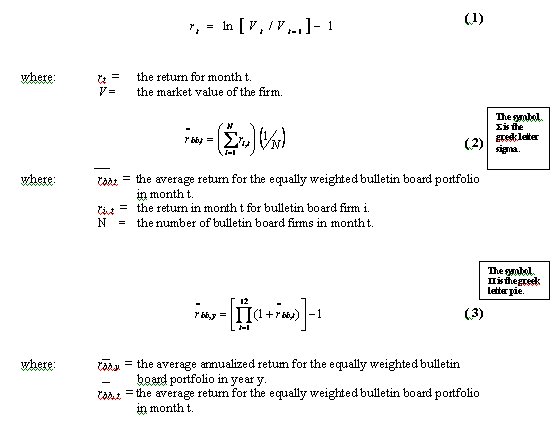
each firm's market value, or monthly returns. The annual mean returns and standard deviations were computed via equations 1 through 4 which are employed by Ibbotson and presented in "Stocks, Bonds, Bills
and Inflation 1998 Yearbook." |
|
|
 |
|
|
Each year, average monthly return relatives from equally weighted portfolios were compounded over the twelve monthly periods, then 1
was subtracted from the resulting value to obtain the average annualized return for the portfolio. The annualized monthly standard deviations were computed by applying equation 4, the formula which appears
in Ibbotson's 1998 Yearbook, but was derived by Haim Levy and Deborah Gunthorpe [1993] |
|
|
 |
|
|
The Levy-Gunthorpe standard deviation is superior to calculating the annualized standard deviation of returns as the product of the
standard deviation of the monthly returns multiplied by the square root of 12. This second method treats the annual return as if it was the sum of the twelve monthly returns. The Levy-Gunthorpe
method is consistent with calculating the annual return as the result of compounding twelve monthly returns and thus provides more accurate and reliable results than the approximation. OTC-BB
performance was judged using the Sharpe Ratio, equation 5, correlation analysis, and Sharpe's Single Index Market Model, equation 6. |
|
|
|
|
 |
|
|
|
Annual Sharpe Ratios and correlation coefficients were generated for equally weighted American Stock Exchange, New York Stock Exchange, Nasdaq,
S&P 500, and OTC-BB portfolios. The Sharpe Ratios were used to judge the relative performance of the portfolios on a risk-adjusted basis, while the correlation coefficients documented the relationship between
the returns generated by the portfolios.Sharpe's Single Index Model, i.e. the Market Model, was estimated twice. Each time, the monthly Bulletin Board portfolio returns were regressed on the monthly
returns for one of the other four portfolios. The first set of Market Model regressions encompassed the entire forty-eight month sample period and was used to determine the magnitude of the sensitivities, betas, between
the Bulletin Board portfolio and the major indices. The second set of regressions focused on the betas' temporal stability by estimating the Market Model over thirty-four month subperiods.
Section 3 Empirical Results |
|
|
|
Exhibit 3: Equally Weighted Index Returns |
| |
|
|
Standard |
Sharpe |
Year |
Market |
Average |
Deviation |
Ratio |
1995 |
AMEX |
26.44% |
10.45% |
1.90 |
| |
NYSE |
35.05% |
7.58% |
3.75 |
| |
NASDAQ |
40.88% |
13.22% |
2.59 |
| |
S&P500 |
37.77% |
8.71% |
3.58 |
| |
OTC-BB |
-15.34% |
12.89% |
-1.70 |
| |
|
|
|
|
1996 |
AMEX |
22.32% |
16.28% |
1.07 |
| |
NYSE |
19.99% |
10.15% |
1.49 |
| |
NASDAQ |
15.87% |
20.59% |
0.54 |
| |
S&P500 |
23.32% |
13.42% |
1.38 |
| |
BB |
13.85% |
37.72% |
0.24 |
| |
|
|
|
|
1997 |
AMEX |
22.37% |
18.07% |
0.94 |
| |
NYSE |
24.53% |
14.92% |
1.29 |
| |
NASDAQ |
17.82% |
23.25% |
0.54 |
| |
S&P500 |
29.39% |
17.87% |
1.35 |
| |
BB |
-4.24% |
31.17% |
-0.31 |
| |
|
|
|
|
1998 |
AMEX |
-9.86% |
18.92% |
-0.78 |
| |
NYSE |
-2.55% |
21.80% |
-0.35 |
| |
NASDAQ |
-1.35% |
30.11% |
-0.21 |
| |
S&P500 |
13.66% |
26.20% |
0.33 |
| |
BB |
-17.90% |
28.16% |
-0.81 |
|
|
|
|
The data presented in Exhibit 3 show the return, risk, and risk-adjusted reward parameters of the major U.S. equity markets and the OTC-BB market
for each calendar year between 1995 and 1998. The most striking results are contained in the Sharpe Ratio column. These data clearly show that on a risk-adjusted basis, an equally weighted portfolio composed
of over the counter bulletin board securities yielded a lower return than found from investing in equally weighted portfolios consisting of securities found on the larger exchanges. In other words, in general and
on a risk-adjusted basis, OTC BB returns were lesser than the returns found on the other major exchanges. Exhibit 4 (A-E)
Correlation of Returns for Equally Weighted Portfolios by Exchange |
|
|
|
Results for 4 Year Period: January 1995 until December 1998 |
OTC-BB |
AMEX |
NYSE |
NASDAQ |
S&P 500 |
OTC-BB |
1.0 |
|
|
|
|
AMEX |
.51 |
1.0 |
|
|
|
NYSE |
.30 |
.90 |
1.0 |
|
|
NASDAQ |
.49 |
.95 |
.88 |
1.0 |
|
S&P 500 |
.24 |
.77 |
.95 |
.77 |
1.0 |
|
|
|
|
|
|
Results for Year Ending December 31, 1995 |
OTC-BB |
AMEX |
NYSE |
NASDAQ |
S&P 500 |
OTC-BB |
1.0 |
|
|
|
|
AMEX |
.59 |
1.0 |
|
|
|
NYSE |
.40 |
.75 |
1.0 |
|
|
NASDAQ |
.67 |
.90 |
.69 |
1.0 |
|
S&P 500 |
.40 |
.53 |
.90 |
.53 |
1.0 |
|
|
|
|
Results for Year Ending December 31, 1996 |
OTC-BB |
AMEX |
NYSE |
NASDAQ |
S&P 500 |
OTC-BB |
1.0 |
|
|
|
|
AMEX |
.65 |
1.0 |
|
|
|
NYSE |
.43 |
.87 |
1.0 |
|
|
NASDAQ |
.55 |
.98 |
.85 |
1.0 |
|
S&P 500 |
.36 |
.70 |
.91 |
.67 |
1.0 |
|
|
|
|
Results for Year Ending December 31, 1997 |
OTC-BB |
AMEX |
NYSE |
NASDAQ |
S&P 500 |
OTC-BB |
1.0 |
|
|
|
|
AMEX |
.34 |
1.0 |
|
|
|
NYSE |
.08 |
.86 |
1.0 |
|
|
NASDAQ |
.45 |
.97 |
.79 |
1.0 |
|
S&P 500 |
.07 |
.63 |
.91 |
.59 |
1.0 |
|
|
|
|
Results for Year Ending December 31, 1998 |
OTC-BB |
AMEX |
NYSE |
NASDAQ |
S&P 500 |
OTC-BB |
1.0 |
|
|
|
|
AMEX |
.57 |
1.0 |
|
|
|
NYSE |
.40 |
.96 |
1.0 |
|
|
NASDAQ |
.49 |
.97 |
.95 |
1.0 |
|
S&P 500 |
.30 |
.91 |
.99 |
.91 |
1.0 |
|
|
|
|
Exhibit 4 identifies the correlation coefficients among equally weighted portfolios consisting of stocks traded on: the OTC - BB, the
American Stock Exchange, the New York Stock Exchange, Nasdaq, and a portfolio comprised of S&P 500 firms. Panel 4A identifies the correlations for the monthly portfolio returns obtained for
the entire forty- eight month sample period. Panels 4 B through 4 E provide correlation coefficients for individual years. In general the relationship of returns of the OTC BB to the American Stock
Exchange, New York Stock Exchange, Nasdaq and the S&P 500 is relatively weak and unstable. The correlation coefficients between the OTC - BB and the four other portfolios fluctuate from year to
year and generally are less than .50. However, the relationship of returns of the American Stock Exchange, New York Stock Exchange, Nasdaq and the S&P 500 to each other is relatively strong and
more stable than the OTC - BB relationship. When we tested the null hypothesis of a zero correlation between each of the portfolios over the entire four year sample period, we found
significant positive relationships between the Bulletin Board and American Stock Exchange, New York Stock Exchange and Nasdaq. No significant relationship between the OTC BB and the S&P 500
portfolio was found during this four year period. The positive and significant relationships between the OTC - BB and the Nasdaq and American Stock Exchange portfolios also were evident in the
individual subperiods:1995, 1996 and 1998. The 1997 results indicated that the OTC BB moved independently of the other four portfolios. Finally, we found no evidence of a significant relationship between
the OTC - BB and either the New York Stock Exchange or the S&P 500 portfolios in any of the individual years. Thus, although significant relationships did exist between the OTC BB and the major
indices, these relationships cannot be considered strong or stable over time. Exhibit 5: Regression Results
Panel 5A: Model Results for 48 Month Period:
January 1, 1995 through December 31, 1998 |
|
|
|
OTC-BB Exchange Versus: |
Beta |
t of Beta |
p of Beta |
Adjusted R2 |
American Stock Exchange |
.944 |
4.04 |
.0002 |
.246 |
Nasdaq |
.678 |
3.77 |
.0004 |
.221 |
NYSE |
.621 |
2.15 |
.0371 |
.071 |
S&P 500 |
.456 |
1.67 |
.1010 |
.037 |
|
|
|
|
Panel 5 B: Significant 34 Month Market Model Regression Results |
|
|
|
| |
Adjusted R2 |
Beta |
t of Beta |
p of Beta |
AMEX
N=15 |
|
|
|
|
Max |
.276 |
1.078 |
3.68 |
.0073 |
Min |
.179 |
.845 |
2.87 |
.0008 |
Mean |
.216 |
.990 |
3.17 |
.0039 |
| |
|
|
|
|
| |
|
|
|
|
NASDAQ
N=15 |
|
|
|
|
Max |
.310 |
.893 |
3.97 |
.0100 |
Min |
.165 |
.638 |
2.74 |
.0004 |
Mean |
.235 |
.787 |
3.34 |
.0029 |
| |
|
|
|
|
| |
|
|
|
|
NYSE
N=5 |
|
|
|
|
Max |
.108 |
.745 |
2.237 |
.0844 |
Min |
.062 |
.551 |
1.781 |
.0324 |
Mean |
.081 |
.639 |
1.971 |
.0603 |
| |
|
|
|
|
| |
|
|
|
|
S&P 500
N=2 |
|
|
|
|
Max |
.088 |
.654 |
2.05 |
.068 |
Min |
.072 |
.612 |
1.89 |
.049 |
Mean |
.080 |
.632 |
1.97 |
.058 |
| |
|
|
|
|
|
|
|
|
The results presented in Exhibit 5 are the estimated parameters of the Market Model regressions. None of which exhibited any
econometric problems that would cause unreliable estimates and require remedial action. Panel 5A contains the results of the four 48 month regressions, while panel 5 B provides results generated via the 34
month subperiod regressions.The first column in panel 5 A identifies the equally weighted portfolio used as the independent variable in the regression. Column 2 presents the estimated
beta, while columns 3 and 4 provide the t values and p values for the estimated betas. The adjusted R squared values, coefficients of variation, are presented in column 5. The t values and p
values show clearly that a positive and significant relationship exists between the OTC - BB and the Amex and Nasdaq portfolios. However, the same cannot be said for the NYSE and S&P 500
portfolios. The relatively low t values and high p values indicate that the betas probably are not different from zero. The adjusted R squared values provide further evidence of a significant
positive relationship between the OTC - BB and the Amex and Nasdaq portfolios where approximately 23% of the variation in the OTC-BB portfolio can be attributed to these two indices. On the other hand, less
than 10% of the OTC-BB portfolio's return variation can be ascribed to the NYSE and S&P 500 portfolios. Thus, there appears to be little relationship between returns of the OTC-BB and the
NYSE and S&P 500. Recall that the subperiod regressions were estimated to examine the behavior of the Market Model betas over time. We faced the problem of examining as many subperiods as
possible without sacrificing econometric rigor. Our solution was to use 34 month subperiods to guarantee enough degrees of freedom and then to examine all 15 of these 34 month periods between
January of 1995 and December of 1998 to obtain as much temporal information as possible. The data in panel 5 B are the result of this methodology. The data reported in panel 5 B
are only for the subperiod regressions that were found to be significant. The most striking result is that all 15 of the subperiod Market Model regressions, N=15, were significant for both the Amex and
Nasdaq portfolios, but that NYSE portfolio produced only five, N=5, significant subperiod regressions while the S&P 500 portfolio yielded only two significant subperiod regressions, N=2. Note that
the average beta and R squared values for the subperiods approximate the values obtained from the 48 month regression. More importantly, the Amex and Nasdaq t values and p values show that the
significant positive relationships between the OTC - BB and these portfolios persist over time. The t values and p values of the NYSE and S&P 500 portfolios do not inspire much confidence and
reveal that the betas probably are not different from zero. Furthermore, the low R squared values are consistent with the overall regression and indicate that less than 10% of the OTC - BB portfolio's
return can be attributed to the NYSE or S&P 500 portfolios. Thus, the portfolio relationships documented and discussed above are also manifested over time in the subperiod regressions. The
regression results presented in Exhibit 5 are consistent with those of Exhibits 3 and 4 and provide further support for the conclusions that significant relationships exist between the OTC - BB portfolios
and the American Stock Exchange and Nasdaq portfolios, while the relationships between the OTC - BB and the New York Stock Exchange and S&P 500 portfolios are much weaker. The results presented in
Exhibits 3 through 5 show that the OTC-BB market in general is much riskier than the major U.S. equity exchanges, and that the relationship between the OTC-BB market and the NYSE, Amex, and Nasdaq is
relatively weak. More importantly, the Sharpe Ratio data in Table 1 shows that an equally weighted OTC - BB portfolio is outperformed, on a risk adjusted basis, by equally weighted Amex, NYSE, Nasdaq and
S&P 500 portfolios. These findings support a conclusion, although circumstantially, that this market is inefficient since investors in the OTC - BB were systematically undercompensated for
the riskiness of the security. This combined with low liquidity tend to produce subnormal returns on the OTC - BB market on a whole. These results lead to two implications for the investment
community. First, the OTC-BB market in general is a viable candidate for diversification strategies. The correlations indicate that the greatest benefits would be enjoyed by those investors who
are invested primarily in NYSE and S&P 500 stocks. Investors who concentrate their portfolios in Amex and Nasdaq stocks should not expect to gain as much as their NYSE and S&P 500 counterparts
by investing in OTC BB stocks. Second, it appears that the OTC-BB market holds promise for obtaining superior returns via good fundamental analysis. The return, risk and regression results were
obtained from equally weighted portfolios that contained all the OTC-BB firms at that point in time. No effort was made to segregate firms based on past performance, size or industry. Although
the risk and return results do not favor the OTC-BB firms, we strongly feel that further empirical research will reveal opportunities for earning excess risk-adjusted returns. If the OTC - BB and markets
like the OTC - BB, such as the NQB, are actually inefficient, then there is an opportunity for investors to find the natural corollarymispriced outliers. These anomalies are less likely to exist on
efficient exchanges, but on an exchange like the OTC BB, there may be opportunities for research-intensive individuals and institutions to produce higher returns based on good fundamental equity
research. Section 4 Summary and Suggestions for Future Research A. SummaryThis study was motivated by the lack of knowledge of the OTC-BB Exchange.
During our study period this market was a U.S. equity market that listed and traded securities of approximately 6,000 firms and provided investors with many opportunities for investment and
diversification. However, the structure and operation of this market remains a mystery to much of the investment community. To date, there is little information and data available about this
market. Thus, it is difficult for an investor to make informed decisions regarding any investment strategies in the OTC-BB market. This research is an initial attempt to provide some empirical
insights and analysis about the Over the Counter Bulletin Board Market. Our study captures valuation information of these quasi-private companies traded on the OTC - BB and measures their
risk and returns between January 1, 1995, and December 31, 1998. The sentiment regarding OTC securities is that they are risky investments. Therefore, we expected to find that, on average, investing in
over the counter securities would produce higher risk than could be observed from investing in larger firms trading on the American Stock Exchange, New York Stock Exchange, and Nasdaq Exchange. Our results
bear this out. We found that a portfolio of equally weighted OTC - BB securities would have yielded a lower return and higher risk (as measured by standard deviation) than obtained by
investing in equally weighted portfolios found on the larger exchanges for the time period of January 1, 1995, through December 31, 1998. We also observed that the relationship of returns of OTC-BB
securities to the securities traded on the American Stock Exchange, New York Stock Exchange, Nasdaq and the S&P 500 is relatively weak. We believe that the reason for these results is the lack of
financial information and poor liquidity. During the period of our study, the OTC firms generally did not disclose their financial information, and daily trading volume averaged less than
$100million. The term "caveat emptor" let the buyer beware - clearly applies when investing in OTC securities. It is not uncommon to find that OTC BB securities contain a
high level of investment risk because they are not required to meet minimum financial statement listing requirements. Their price volatility is high in part because of low liquidity and trading volume and
there is little third party research on these firms. As a result, these small firms, which are early in their life cycle, contain substantial operating and business risk. B. Future ResearchOne area for future research is to create a
comprehensive small cap index that includes the OTC-BB firms as well as the Nasdaq and Amex firms. Today's indices (i.e., the Wilshire 5000 or Russell 2000) do not capture the financial performance of
OTC BB traded securities. By omitting the impact of thousands of firms, all of the indices omit a large amount of relevant financial information. The resulting problems are unreliable small cap
returns and survivorship bias. It is quite possible that these indices produce skewed small stock premiums by overlooking the returns of thousands of small cap firms. Furthermore, the indices
misstate the risk and returns generated by the market because they only capture pricing data from firms traded on the NYSE, ASE and Nasdaq. When a firm is delisted from one of these exchanges, it
typically becomes listed on the OTC BB Exchange. From a statistical point of view, the "market's" cited returns can be criticized for containing "survivorship bias" as it only captures returns from
financially stronger firms. A comprehensive small cap index will provide reliable risk and return estimates without suffering from survivorship bias. A second area warranting further
research is portfolio construction. Investing (prudently) in OTC securities warrants further research as an investment strategy to obtain un-correlated returns vis-à-vis investing in securities traded on the
American Stock Exchange, New York Stock Exchange, Nasdaq and the S&P 500. Creating a diversified portfolio combining OTC-BB securities with securities traded on the American Stock Exchange, New York
Stock Exchange and Nasdaq exchange should be a potential investment strategy. The finding that there appears to be an inverse relationship between risk and return on the OTC BB is a
third area for future research. This result was surprising and should be explored more thoroughly via portfolio strategies. A fourth topic that deserves attention is the effect of the OTC - BB
Eligibility Rule which forces firms to disclose their financial information. The research could be structured as an event study employing the cumulative abnormal return methodology, where June 2000 is
the event date. Finally, when investing, performing research is always crucial. It is of even greater importance, however, when investing in OTC-BB securities due to the lack of
independent information and greater company specific risk. Certainly
more research into the behavior of retail investors when faced with low information and liquidity is needed. |
|
|
|
|
|
|
|
References Levy, Haim, and Deborah
Gunthorpe. "Optimal Investment Proportions in Senior Securities and Equities Under Alternative Holding Periods."Journal of Portfolio Management, Summer 1993, pp 30 36.
Sharpe, William F. Portfolio Theory and Capital Markets. New York: Mc Graw-Hill Publishers, 1970. "Stocks, Bonds, Bills and Inflation: 1998 Yearbook." Chicago: Ibbotson Associates, Inc.
1998. |
|
|
End Notes:Despite sharing the roots of a
common name, the OTC BB should not be confused with The Nasdaq Stock MarketSM; they are unrelated entities. Our study measured financial performance of OTC equity securitiesnot
ADR's or DPP's traded on the Exchange. The OTC - BB only began capturing trading data electronically from January 1, 1995the beginning date of our study. |
|
|
Authors:Carl Luft, Ph.D. Associate Professor of Finance DePaul University Lawrence M. Levine
Director Corporate Finance Services, American Express Tax and Business Services Inc. Scott Larson Intermediate Research Analyst, Allstate Insurance (The opinions expressed in this article are those of the authors and do not purport to represent the opinions of American Express Company, DePaul University, or
Allstate or their staffs) |
|
|
|
|
|
|
Allstocks.com Penny Stocks OTC BB Listings |
|
|
|
 |
|
|
|
Advertising Information Click Here! |
|
|
|
© 1998 - 2019 Allstocks.com. All rights reserved. |
|
|
|
|
|
|
|
|